Understanding JVM Arguments
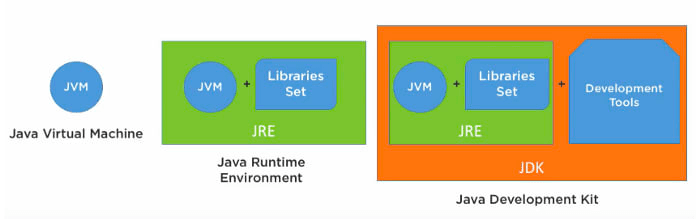
Quick Recall of JVM , JRE and JDK
What are JVM Arguments
A string that contains the arguments that are passed to the JVM that the driver is starting
The generic Java™ virtual machine (JVM) arguments are optional command-line arguments that are passed to the JVM when Application Server starts. The generic JVM arguments can set the -
- timeout value for the server-side Java remote method invocation (RMI)
- disable explicit garbage collection
- set the garbage collection policy, and specify the nursery size.
User Defined Arguments
Standard Options (-D but not only)
These are the most commonly used options that are supported by all implementations of the JVM.You use -D to specify System properties but most of them don’t have any prefix :-verbose, -showversion, and so for.If you do not specify anything like -myProp=”XYZ” it means it is passed as an argument to main method of the program.
- D means you can use this value using System.getProperty
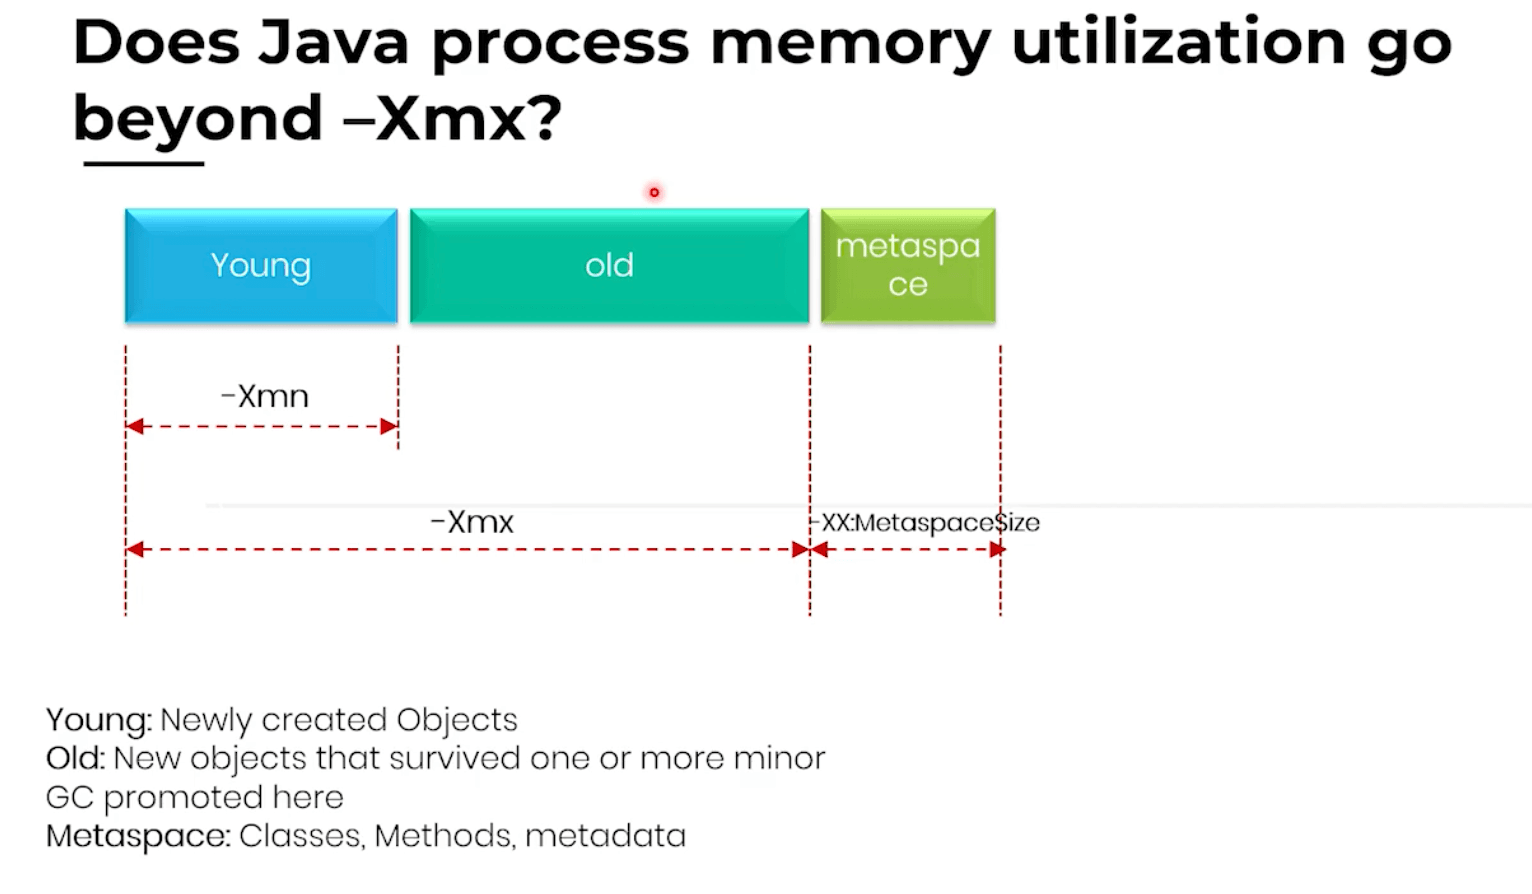
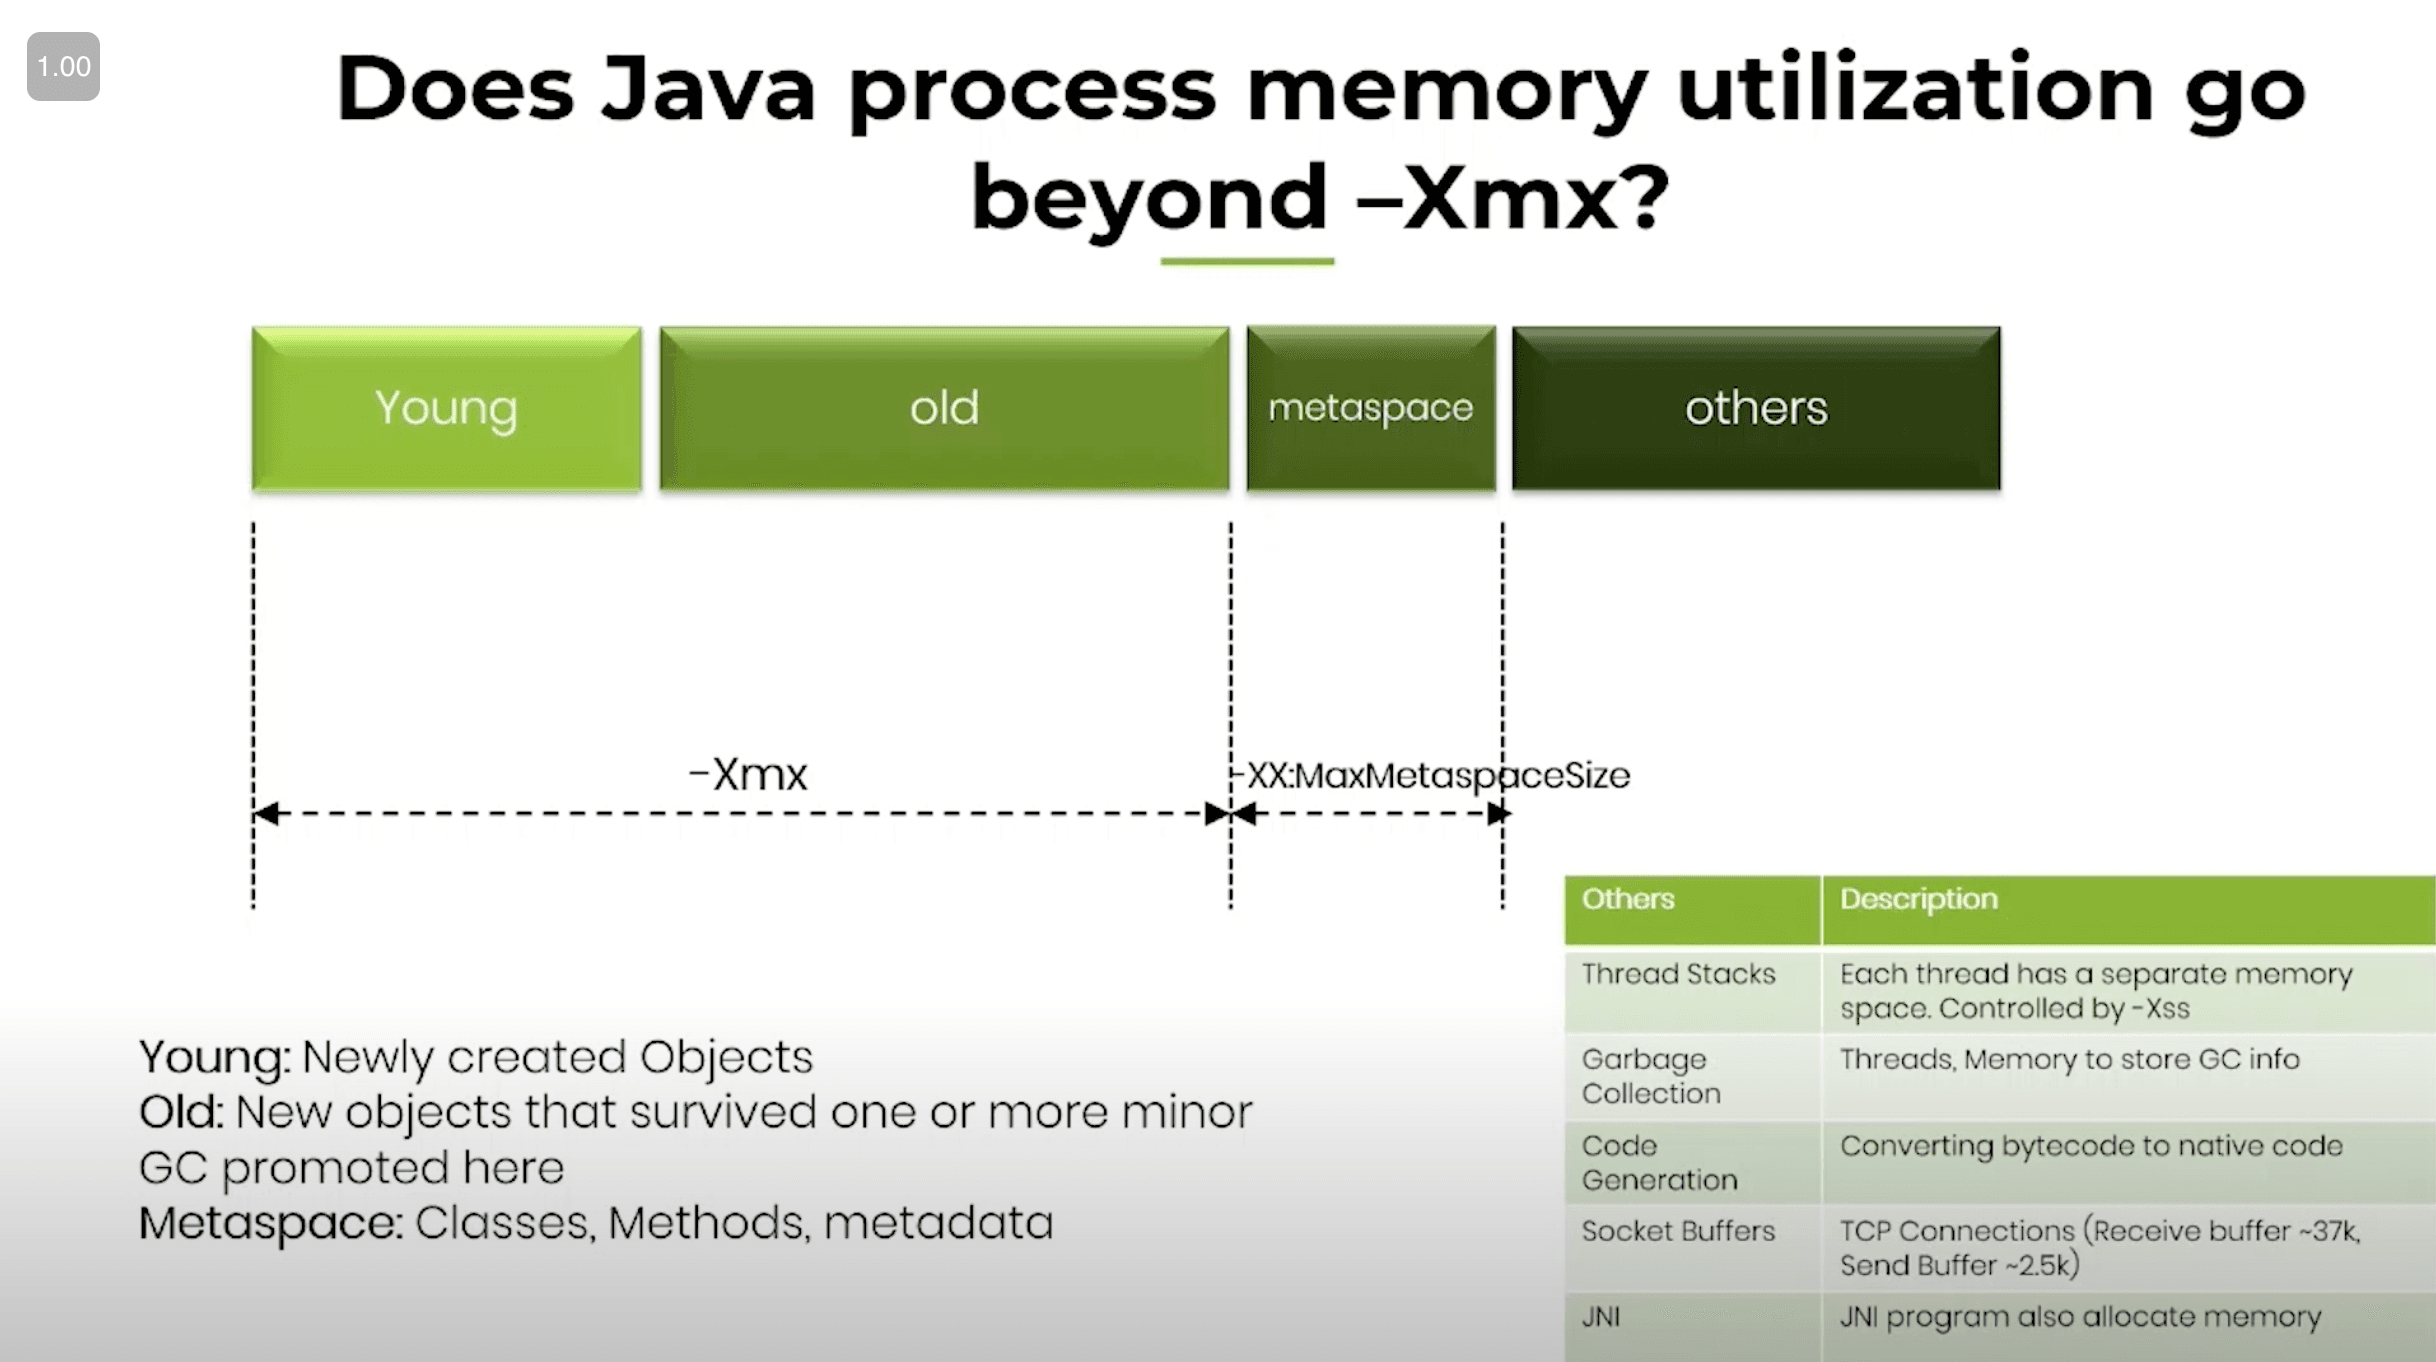
JVM Memory
When specifying the heap size for the JVM, note that the JVM tries to allocate the heap memory as a single contiguous range of addresses in the application’s memory address space.
If the application’s address space is fragmented so that there is no contiguous range of addresses big enough for the amount of memory specified for the JVM, the driver fails to load, because the JVM cannot allocate its heap. This situation is typically encountered only with 32-bit applications, which have a much smaller application address space. If you encounter problems with loading the driver in an application, try reducing the amount of memory requested for the JVM heap. If possible, switch to a 64-bit version of the application.
Topic Like these be Overwhelming

While working across application the popular ones one might come across for brief understanding we will glance through these 7:
1. -Xmx and -XX:MaxMetaspaceSize
Xmxis probably the most important JVM argument.Xmxdefines the maximum amount of heap size you are allocating to your application. (To learn about different memory regions in a JVM, you may watch this short video clip). You can define your application’s heap size like this:
2. GC Algorithm
As of March 2020, there are 7 different GC algorithms in OpenJDK:
- Serial GC.
- Parallel GC.
- Concurrent Mark and Sweep GC.
- G1 GC.
- Shenandoah GC.
- Z GC.
- Epsilon GC.
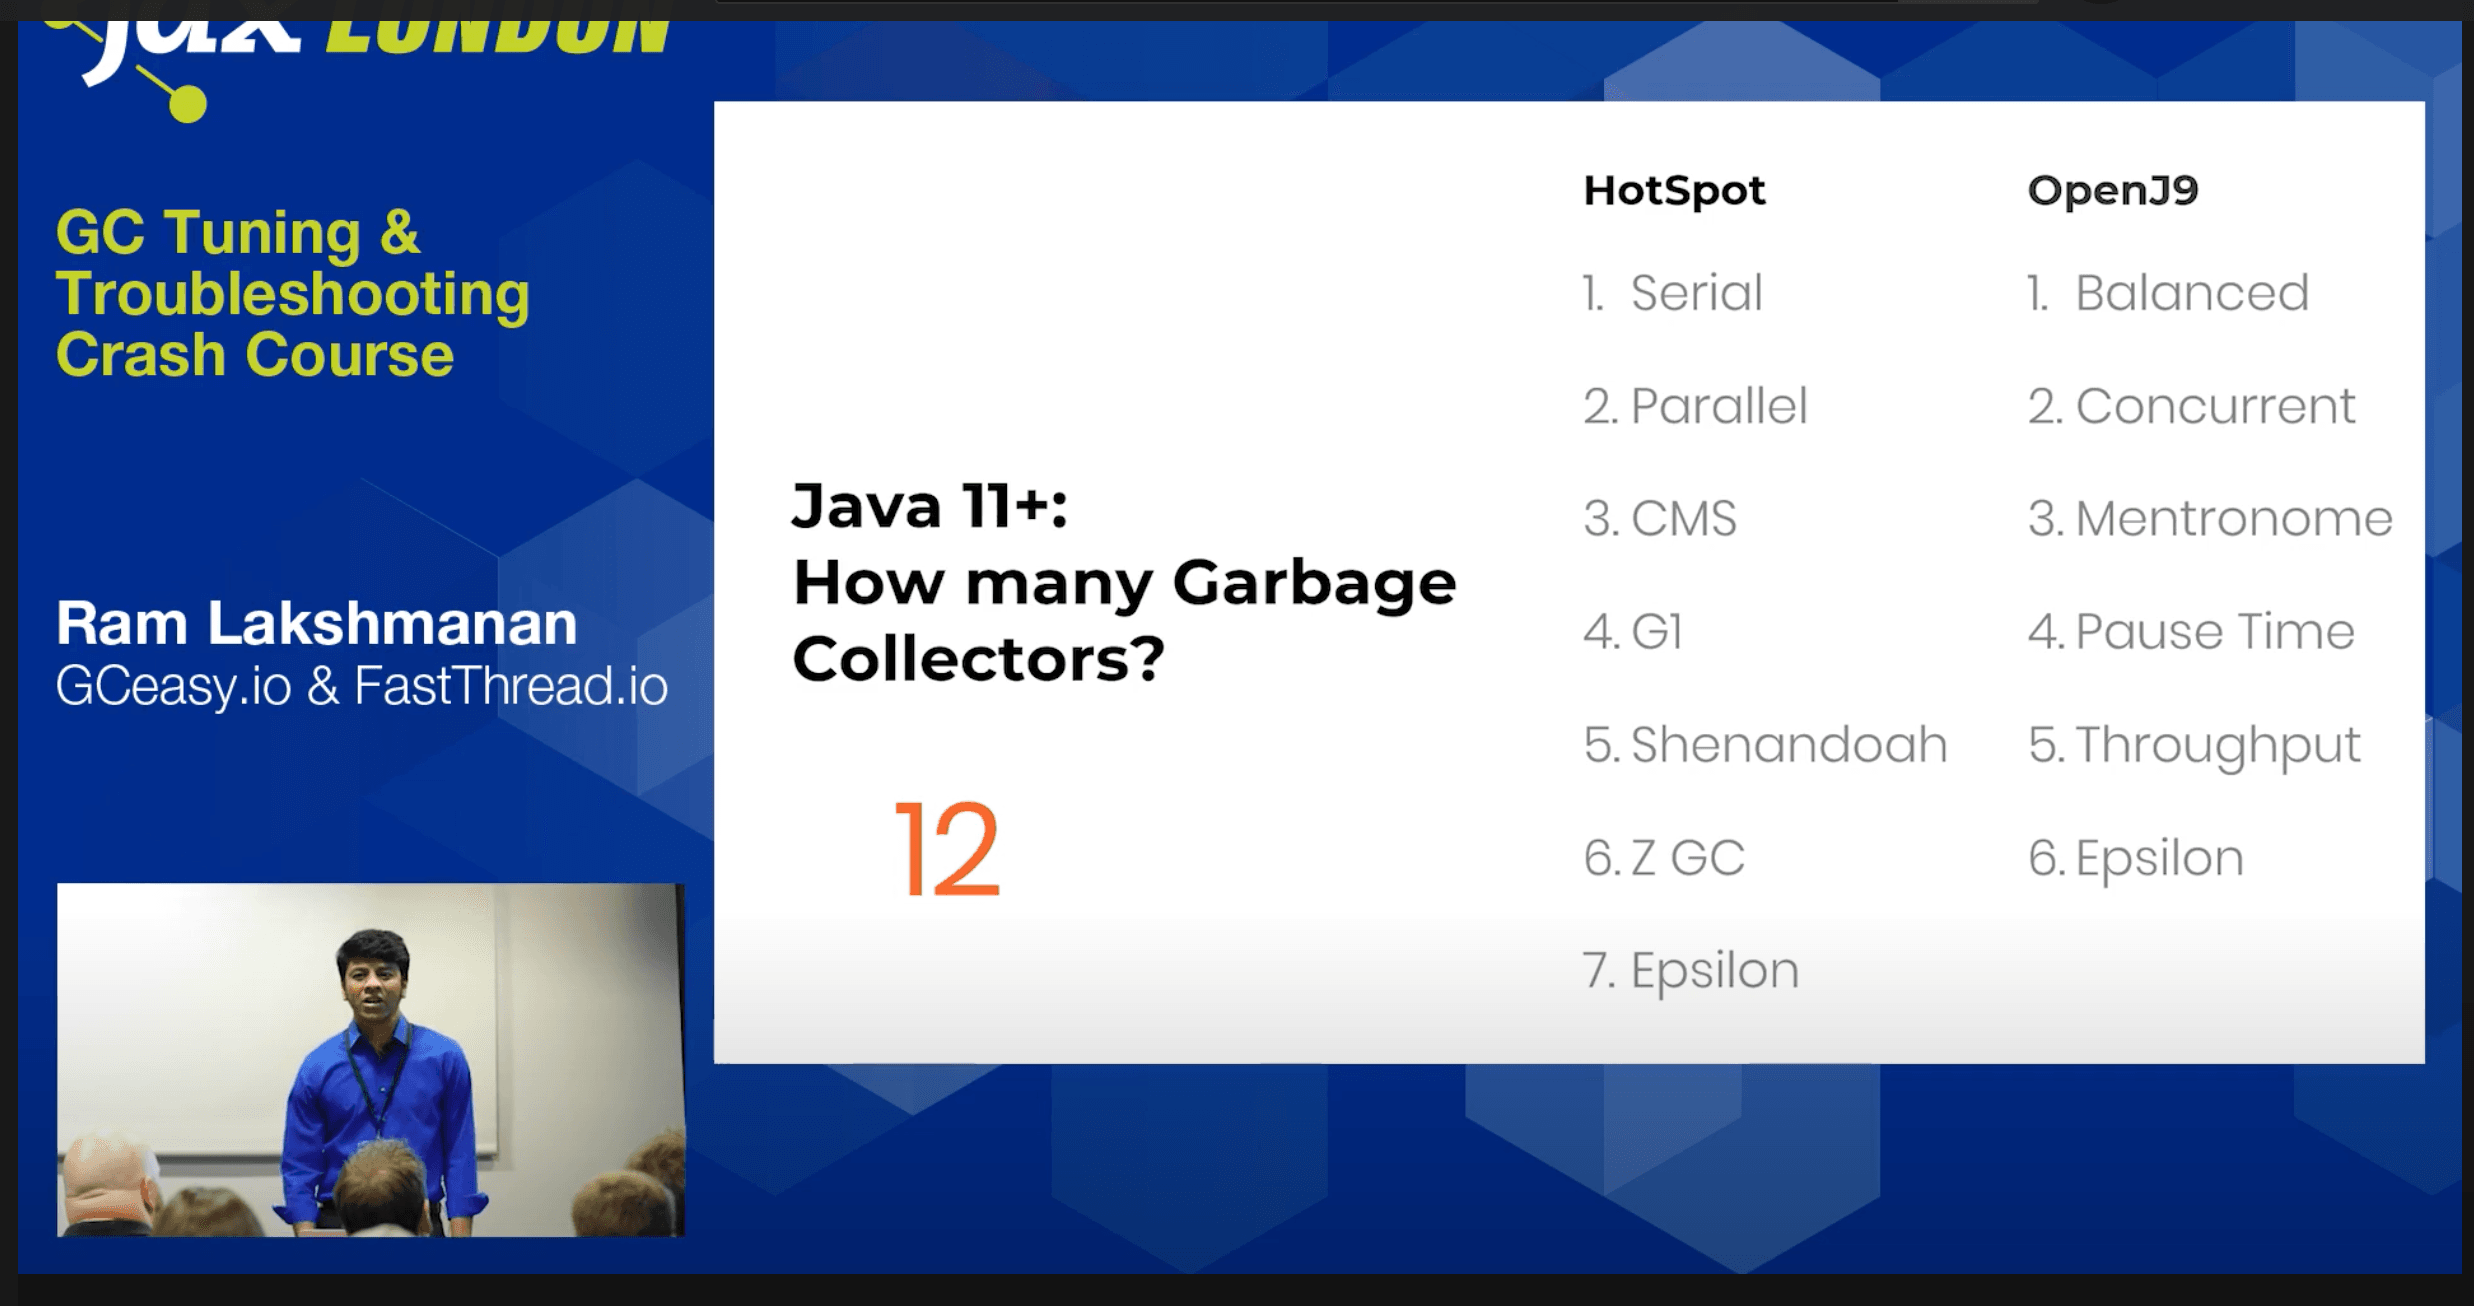
If you don’t specify the GC algorithm explicitly, then JVM will choose the default algorithm. Until Java 8, Parallel GC is the default GC algorithm. Since Java 9, G1 GC is the default GC algorithm.
3. Enable GC Logging
Garbage Collection logs contain information about Garbage Collection events, memory reclaimed, pause time duration, etc. You can enable the garbage collection log by passing following JVM arguments:
Typically, GC logs are used for tuning garbage collection performance. However, GC logs contain vital micro metrics. These metrics can be used for forecasting an application’s availability and performance characteristics.
In this article, we would like to highlight one such micrometric: ‘GC Throughput‘ (to read more on other available micrometrics, you may refer to this article).

4. -XX:+HeapDumpOnOutOfMemoryError, -XX:HeapDumpPath
OutOfMemoryError is a serious problem that will affect your application’s availability/performance SLAs. To diagnose OutOfMemoryError or any memory-related problems, one would have to capture the heap dump right at the moment or few moments before the application starts to experience OutOfMemoryError.
As we don’t know when OutOfMemoryError will be thrown, it’s hard to capture the heap dump manually at the right around the time. However, capturing heap dumps can be automated by passing following JVM arguments:

5. -Xss
Each application will have tens, hundreds, thousands of threads. Each thread will have its own stack. In each thread’s stack following information are stored:
- Methods/functions that are currently executed.
- Primitive datatypes.
- Variables.
- Object pointers.
- Return values.
Each one of them consumes memory. If their consumption goes beyond a certain limit, then a StackOverflowError is thrown. More details about StackOverflowError and solutions to resolve it can be found in this article. However, you can increase the thread’s stack size limit by passing the -Xss
6. -Dsun.net.client.defaultConnectTimeout and -Dsun.net.client.defaultReadTimeout
Modern applications use numerous protocols (i.e. SOAP, REST, HTTP, HTTPS, JDBC, RMI, etc.) to connect with remote applications. Sometimes remote applications might take a long time to respond. Sometimes they may not respond at all.
If you don’t have proper timeout settings, and if remote applications don’t respond fast enough, then your application threads/resources will get stuck. Remote applications unresponsiveness can affect your application’s availability. It can bring down your application to a grinding halt. To safeguard your application’s high availability, appropriate timeout settings should be configured.
7. -Duser.timeZone
Your application might have sensitive business requirements around time/date. For example, if you are building a trading application, you can’t take a transaction before 9:30 am. To implement those time/date related business requirements, you might be using java.util.Date or java.util.Calendar objects.
These objects, by default, pick up time zone information from the underlying operating system. This will become a problem if your application is running in a distributed environment.
Example : If your application is running across multiple data centers, say, San Francisco, Chicago, Singapore – then JVMs in each data center would end up having a different time zone. Thus, JVMs in each data center would exhibit different behaviors. It would result in inconsistent results.
Source : DZONE
1
There are 600+ arguments that you can pass to JVM just around garbage collection and memory. If you include other aspects, the number of JVM arguments will easily cross 1000+
Example
- Xmn1024m
Sets the size of the nursery to 25% of the maximum heap size. The nursery is the area in the heap where objects are created. If you analyze the garbage collection and then adjust the heap sizes, adjust the nursery size to reflect your changes.
- Xdisableexplicitgc
Disables explicit garbage collection, which prevents System.gc() calls from starting the garbage collection process.
- Xgcpolicy:gencon
Sets the garbage collection policy to gencon garbage collection, which places objects in separate areas of the heap based on their lifetime. After objects are created in the nursery and then survive a number of garbage collections, the objects are moved to a tenured area. When objects are separated in this way, garbage collection can run more frequently in the nursery without affecting the rest of the heap, which keeps pauses to a minimum. Because Maximo® Asset Management creates many short-lived objects, set the garbage collection policy to gencon.
Reference
- https://www.baeldung.com/jvm-parameters
- https://dzone.com/articles/7-jvm-arguments-of-highly-effective-applications-1
- https://www.youtube.com/watch?v=uJLOlCuOR4k&t=9s
- https://www.youtube.com/watch?v=6G0E4O5yxks