Apple Silicon Kernel Panic Report
Apple silicon kernel panic report to identify what failed, where it was detected, and what the report tells us about the cause.
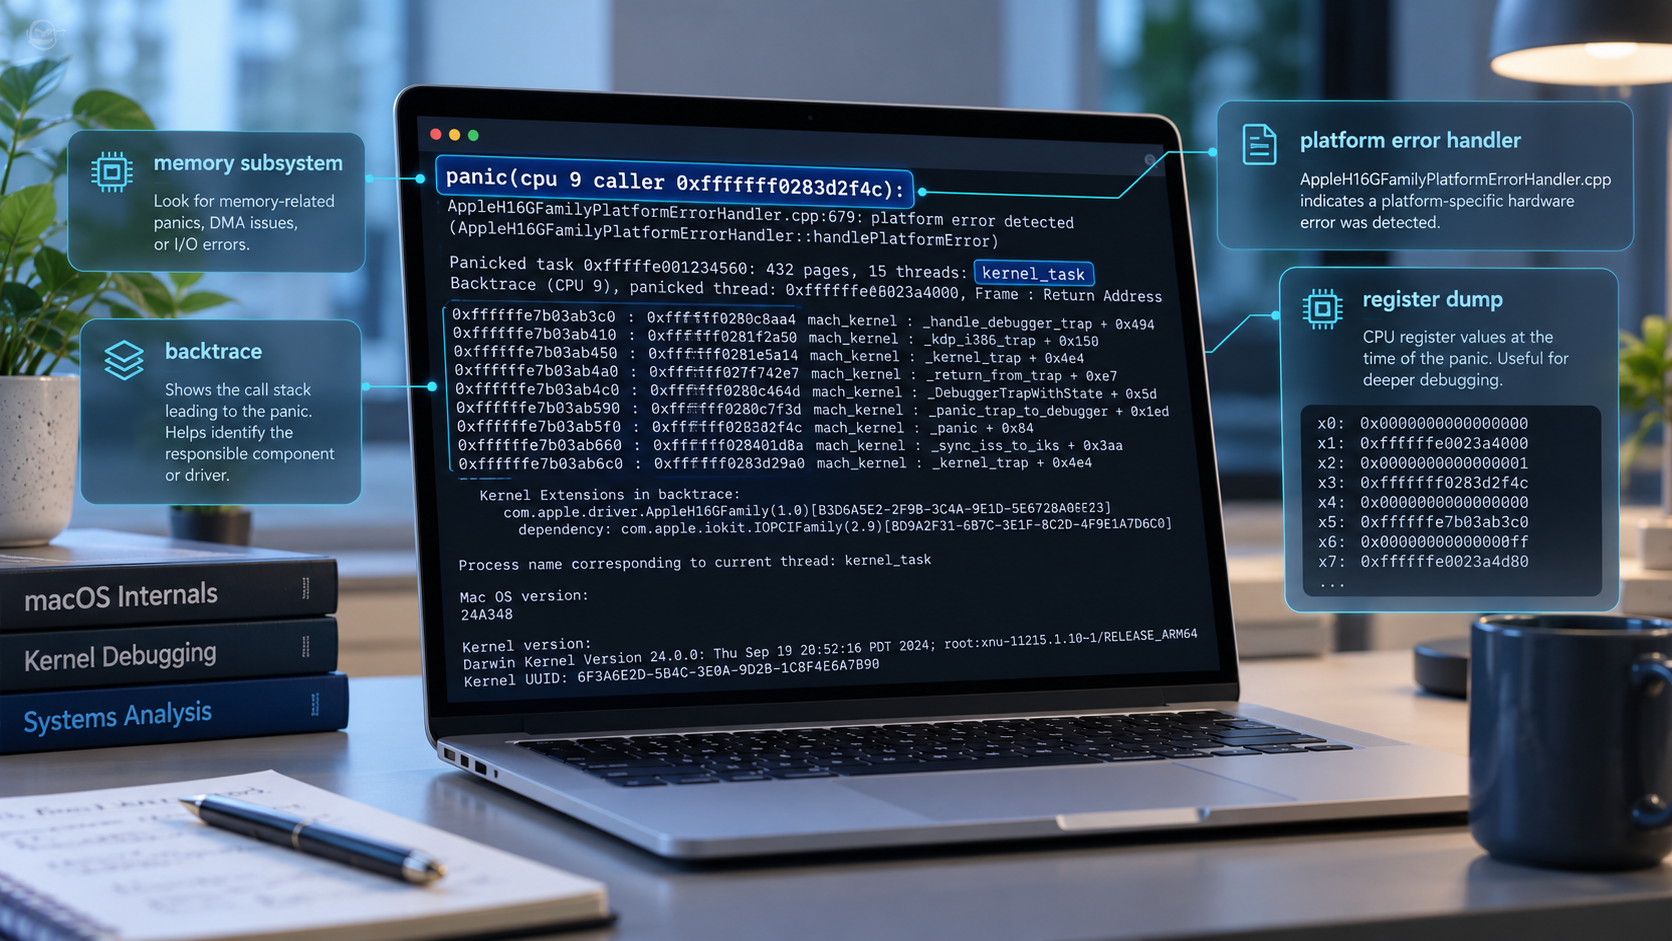
Your Mac freezes, restarts, and shows you a report full of hexadecimal numbers.
It looks intimidating. But you don’t need to understand every address to extract useful information. You need to identify what failed, who detected it, and how much the report actually tells you about the cause.
Let’s walk through this report.
Start with the first line
1
2
3
4
panic(cpu 9 caller ...):
"AMCC0 DCS GROUP 2 CHANNEL 0 M3_AIC_IRQ_EN_FLD error:
INTSTS 0x00000008 ..."
@AppleH16GFamilyPlatformErrorHandler.cpp:4281
This is the most useful line in the report.
A kernel panic means the operating system encountered a condition it could not safely recover from. Instead of continuing, it stopped.
An ordinary application crash usually takes down one process. A kernel panic takes down the operating system.
The cpu 9 field tells us which CPU core executed the panic. It does not tell us that core 9 is broken.
The caller address identifies the code location that invoked the panic. Without matching debugging symbols, that address has limited value to us.
The error message and source filename provide much more context.
The component detecting a failure matters
The message names AMCC0 and a DCS group and channel. These point toward the Apple silicon memory-controller subsystem.
Then we see:
1
AppleH16GFamilyPlatformErrorHandler.cpp:4281
Apple’s platform error handler detected the condition and triggered the panic.
That gives us a useful working diagnosis: this is a low-level chip/platform error involving the memory subsystem.
But there is an important distinction between where an error was detected and what originally caused it.
A hardware controller can encounter a bad state because of defective hardware. It can also encounter a bad state because software or firmware configured something incorrectly.
This report does not settle that distinction.
It also does not establish a bad RAM chip, a particular defective channel, or a required logic-board replacement.
Don’t guess what the hexadecimal values mean
The first line includes:
1
2
3
4
5
INTSTS 0x00000008
CLLT_STATUS 0x007f001f
ISP_CTL ...
DISP_CTL ...
AUDIO_BASE_S_ADMA_CTL ...
These are snapshots of hardware registers.
Registers contain status flags and configuration fields. Engineers can decode them using documentation for that particular chip and register layout.
Without those definitions, assigning a meaning to 0x00000008 would be speculation.
Likewise, seeing DISP_CTL does not prove the display caused the crash. Seeing an audio register does not prove the audio subsystem failed.
An error handler can dump several related registers to preserve context. The presence of a component in the dump is evidence that its state was recorded.
Identify the process that panicked
Further down:
1
Panicked task ... pid 0: kernel_task
This tells us the panic occurred in the kernel’s execution context.
It does not identify a user application as the culprit.
An application could have triggered an operation that exposed an underlying problem—for example, rendering graphics or accessing a device. But this report does not name such an application or establish that chain of events.
Read the backtrace as a path, not a verdict
The backtrace contains a series of addresses representing the active call chain.
The report also identifies kernel extensions associated with that chain:
1
2
com.apple.driver.AppleT8132
com.apple.driver.AppleInterruptControllerV3
These names support the interpretation that the panic passed through Apple’s platform and interrupt-handling code.
However, appearing in a backtrace does not automatically make a driver the root cause. A driver might be handling an error raised somewhere else.
Think of a backtrace as evidence about the path through the system when the failure was handled.
Check whether memory pressure explains it
This report says:
1
2
3
4
Compressor Info:
13% of compressed pages limit (OK)
26% of segments limit (OK)
with 7 swapfiles and OK swap space
That argues against a straightforward “the Mac ran out of memory” explanation.
Seven swapfiles might sound alarming, but their existence alone does not demonstrate a fault. The report explicitly marks the relevant limits and swap space as OK.
Also, memory pressure and memory-controller errors are different categories. Having enough available memory does not establish that the hardware and firmware managing it are healthy.
The last loaded extension is only a clue
Near the end:
1
2
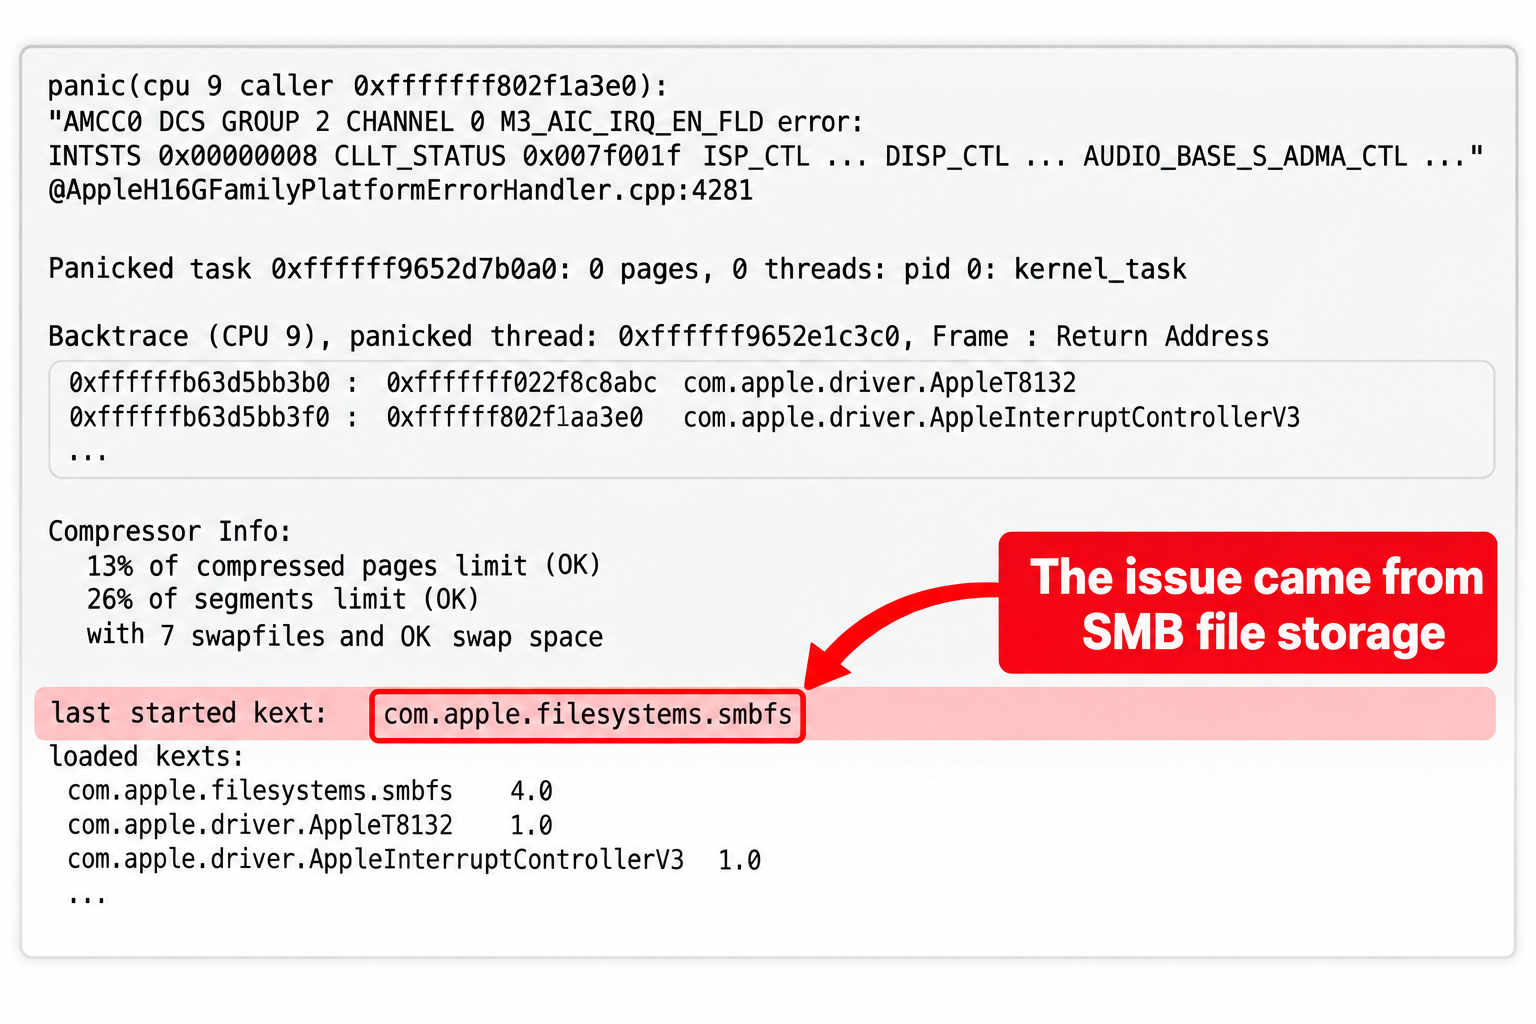
last started kext:
com.apple.filesystems.smbfs
This is Apple’s SMB filesystem extension, used for network file sharing.
“Last started” describes ordering. It does not establish causation, and this extension is not listed among the extensions in the backtrace.
Summary
RAW Dump
1
2
3
4
5
6
7
8
9
10
11
12
13
14
15
16
17
18
19
20
21
22
23
24
25
26
27
28
29
30
31
32
33
34
35
36
37
38
39
40
41
42
43
44
45
46
47
48
49
50
51
52
53
54
55
56
57
58
59
60
61
62
63
64
65
66
67
68
69
70
71
72
73
74
75
76
77
78
79
80
81
82
83
84
85
86
87
88
89
90
91
92
93
94
95
96
97
98
99
100
101
102
103
104
105
106
107
108
109
110
111
112
113
114
115
116
117

panic(cpu 9 caller 0xfffffe0047104e14): "AMCC0 DCS GROUP 2 CHANNEL 0 M3_AIC_IRQ_EN_FLD error: INTSTS 0x00000008 CLLT_STATUS 0x007f001f CLLT_GLB_CTL 0x00000216 ISP_CTL 0x7f7f0001 DISP_CTL 0x7f000007 DISPEXT0_CTL 0x7f7f0007 DISPEXT1_CTL 0x7f7f0007 SCODEC_CTL 0x7f7f0007 AUDIO_BASE_S_ADMA_CTL 0x7f7f0007 AUDIO_BASE_NS_ADMA_CTL 0x7f7f0007 AUDIO_LEAP_S_ADMA_CTL 0x7f7f0007 AUDIO_LEAP_NS_ADMA_CTL 0x7f7f0007 FREQ_CHANGE_CTL 0x0000001f CALIBRATE_CTL 0x0007001d PMC_ESCALATION_CTL 0x00080000 ACC0CPM_PG_CTL 0x00080100 ACC1CPM_PG_CTL 0x00080100 FAST_AF_CLK_SCAL" @AppleH16GFamilyPlatformErrorHandler.cpp:4281
Debugger message: panic
Memory ID: 0xff
OS release type: User
OS version: 26A428
Kernel version: Darwin Kernel Version 27.0.0: Tue Aug 11 21:02:57 PDT 2026; root:xnu-13432.1.9~1/RELEASE_ARM64_T8132
Fileset Kernelcache UUID: CAEEBDE7777C9CEE771C40DF40D4B1D2
Kernel UUID: 815C54ED-2B20-3364-B78C-B87C506D28C6
Boot session UUID: B56B5730-8510-4989-B00A-CFFCFF328A28
iBoot Stage 1 version: mBoot-20457.1.29
iBoot version: mBoot-20457.1.29
secure boot?: YES
roots installed: 0
Paniclog version: 16
Debug Header address: 0xfffffe00242c5000
Debug Header entry count: 3
TXM load address: 0xfffffe00341c4000
TXM UUID: 3B35DCEB-F998-3668-995D-74DFC7A0B6EB
Debug Header kernelcache load address: 0xfffffe00441c4000
Debug Header kernelcache UUID: CAEEBDE7-777C-9CEE-771C-40DF40D4B1D2
SPTM version: SPTM-820.0.22|2026-08-08:13:06:06.975686|
SPTM load address: 0xfffffe00241c4000
SPTM UUID: DBE86ABE-34C7-370C-B183-EE530F5F7E69
KernelCache slide: 0x000000003d1c0000
KernelCache base:  0xfffffe00441c4000
Kernel slide:      0x000000003d1c8000
Kernel text base:  0xfffffe00441cc000
Kernel text exec slide: 0x0000000041de8000
Kernel text exec base:  0xfffffe0048dec000
mach_absolute_time: 0x73ca5b5f237
Epoch Time:        sec       usec
  Boot    : 0x6ab66ba2 0x00028ce8
  Sleep   : 0x6abaa5df 0x000a0f5c
  Wake    : 0x6abaa60d 0x00023da4
  Calendar: 0x6abbcdaa 0x0002575e

Zone info:
  Zone map: 0xfffffe111c000000 - 0xfffffe371c000000
  . VM    : 0xfffffe111c000000 - 0xfffffe16e8000000
  . RO    : 0xfffffe16e8000000 - 0xfffffe1982000000
  . GEN0  : 0xfffffe1982000000 - 0xfffffe1f4e000000
  . GEN1  : 0xfffffe1f4e000000 - 0xfffffe251a000000
  . GEN2  : 0xfffffe251a000000 - 0xfffffe2ae6000000
  . GEN3  : 0xfffffe2ae6000000 - 0xfffffe30b2000000
  . DATA  : 0xfffffe30b2000000 - 0xfffffe371c000000
  Metadata: 0xfffffe9422010000 - 0xfffffe942b810000
  Bitmaps : 0xfffffe942b810000 - 0xfffffe942e604000
  Extra   : 0 - 0

CORE 0 [EACC0] recently retired instr at 0x0000000000000000
CORE 1 [EACC0] recently retired instr at 0x0000000000000000
CORE 2 [EACC0] recently retired instr at 0x0000000000000000
CORE 3 [EACC0] recently retired instr at 0x0000000000000000
CORE 4 [EACC0] recently retired instr at 0x0000000000000000
CORE 5 [EACC0] recently retired instr at 0x0000000000000000
CORE 6 [PACC1] recently retired instr at 0x0000000000000000
CORE 7 [PACC1] recently retired instr at 0x0000000000000000
CORE 8 [PACC1] recently retired instr at 0x0000000000000000
CORE 9 [PACC1] recently retired instr at 0x0000000000000000
TPIDRx_ELy = {1: 0xfffffe251ca3aab0  0: 0x0001000000001009  0ro: 0x0000000000000000 }
CORE 0: PC=0xfffffe0048fd22b8, LR=0xfffffe0048fd22b4, FP=0xfffffea87927be50
CORE 1: PC=0x0000000192c35188, LR=0x0000000192c35250, FP=0x000000016b8aa5a0
CORE 2: PC=0xfffffe0048fd22b8, LR=0xfffffe0048fd22b4, FP=0xfffffea8766dbe50
CORE 3: PC=0x000000018ed3d524, LR=0x000000023b842b08, FP=0x000000016b82d740
CORE 4: PC=0xfffffe0048fd22b8, LR=0xfffffe0048fd22b4, FP=0xfffffea876a9be50
CORE 5: PC=0xfffffe0048fd22b8, LR=0xfffffe0048fd22b4, FP=0xfffffea8767ebe50
CORE 6: PC=0xfffffe0048fd22b8, LR=0xfffffe0048fd22b4, FP=0xfffffea875debe50
CORE 7: PC=0xfffffe0048e82154, LR=0xfffffe0048e82154, FP=0xfffffea8730dbee0
CORE 8: PC=0xfffffe0048e82154, LR=0xfffffe0048e82154, FP=0xfffffea87391bee0
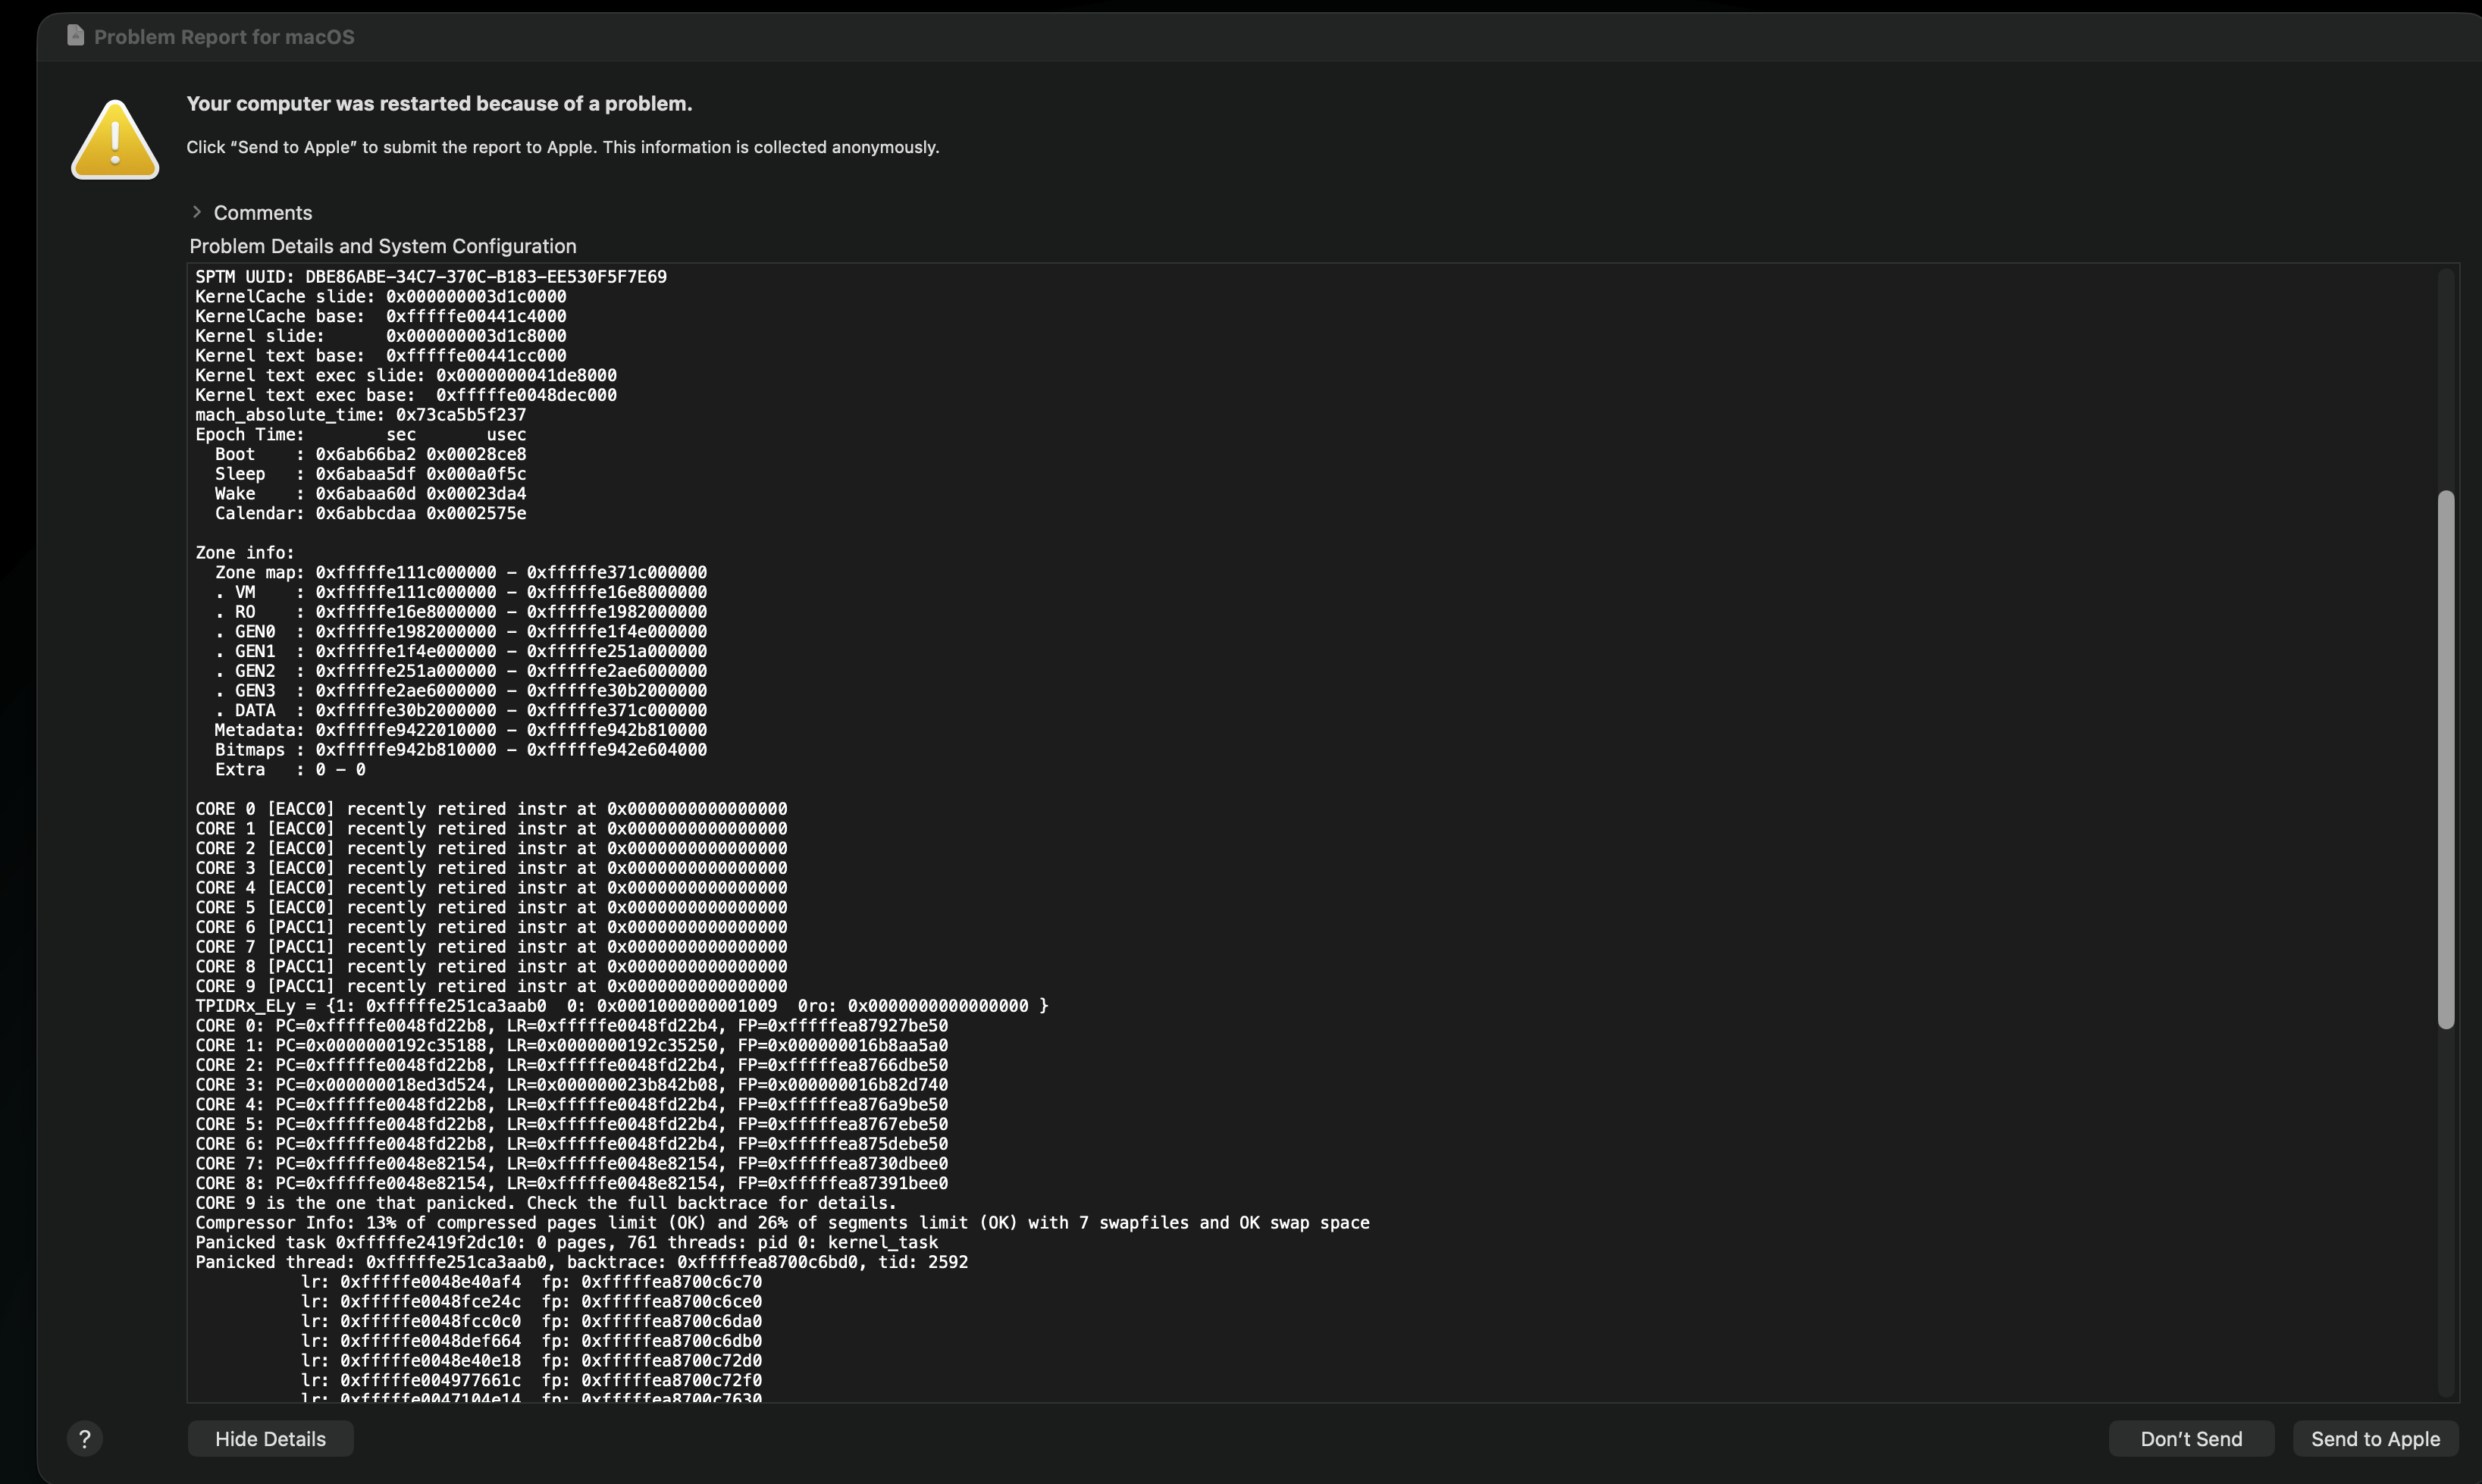
CORE 9 is the one that panicked. Check the full backtrace for details.
Compressor Info: 13% of compressed pages limit (OK) and 26% of segments limit (OK) with 7 swapfiles and OK swap space
Panicked task 0xfffffe2419f2dc10: 0 pages, 761 threads: pid 0: kernel_task
Panicked thread: 0xfffffe251ca3aab0, backtrace: 0xfffffea8700c6bd0, tid: 2592
		  lr: 0xfffffe0048e40af4  fp: 0xfffffea8700c6c70
		  lr: 0xfffffe0048fce24c  fp: 0xfffffea8700c6ce0
		  lr: 0xfffffe0048fcc0c0  fp: 0xfffffea8700c6da0
		  lr: 0xfffffe0048def664  fp: 0xfffffea8700c6db0
		  lr: 0xfffffe0048e40e18  fp: 0xfffffea8700c72d0
		  lr: 0xfffffe004977661c  fp: 0xfffffea8700c72f0
		  lr: 0xfffffe0047104e14  fp: 0xfffffea8700c7630
		  lr: 0xfffffe00471051fc  fp: 0xfffffea8700c7ef0
		  lr: 0xfffffe004966cc6c  fp: 0xfffffea8700c7f30
		  lr: 0xfffffe0046a56bec  fp: 0xfffffea8700c7fc0
		  lr: 0xfffffe0048fcf9d0  fp: 0xfffffea8700c7fe0
		  lr: 0xfffffe0048def708  fp: 0xfffffea8700c7ff0
		  lr: 0xfffffe004946f500  fp: 0xfffffea8730ab4d0
		  lr: 0xfffffe004948c8d4  fp: 0xfffffea8730ab540
		  lr: 0xfffffe004948ca40  fp: 0xfffffea8730ab5a0
		  lr: 0xfffffe0049286828  fp: 0xfffffea8730ab700
		  lr: 0xfffffe00492d1a5c  fp: 0xfffffea8730ab8f0
		  lr: 0xfffffe0049285ed0  fp: 0xfffffea8730ab9c0
		  lr: 0xfffffe0049283b28  fp: 0xfffffea8730abcc0
		  lr: 0xfffffe004917ee0c  fp: 0xfffffea8730abcf0
		  lr: 0xfffffe004912d780  fp: 0xfffffea8730abd60
		  lr: 0xfffffe0049126294  fp: 0xfffffea8730abda0
		  lr: 0xfffffe00491256c4  fp: 0xfffffea8730abec0
		  lr: 0xfffffe00491267bc  fp: 0xfffffea8730abf20
		  lr: 0xfffffe0048df03cc  fp: 0x0000000000000000
      Kernel Extensions in backtrace:
         com.apple.driver.AppleT8132(1.0)[D95BD92F-D4A4-3BC4-9AC3-269D14447CD7]@0xfffffe00470f8130->0xfffffe0047108fdb
            dependency: com.apple.driver.AppleARMPlatform(1.0.2)[3591523E-9BA3-3A35-AD85-D9C32E603A1C]@0xfffffe0045e2a520->0xfffffe0045e838c7
            dependency: com.apple.driver.AppleEverestErrorHandler(1)[3FD29E30-5CAB-306A-B5B2-D5D00C453D32]@0xfffffe0046665d90->0xfffffe0046666e03
            dependency: com.apple.iokit.IOReportFamily(47)[A0D32A4A-34BA-3C0F-B0FE-536634807EB0]@0xfffffe0048165d40->0xfffffe00481691df
         com.apple.driver.AppleInterruptControllerV3(1.0d1)[75FC5D32-A881-3EE8-A1D0-D7C807B833C7]@0xfffffe0046a53a30->0xfffffe0046a58373
            dependency: com.apple.driver.AppleARMPlatform(1.0.2)[3591523E-9BA3-3A35-AD85-D9C32E603A1C]@0xfffffe0045e2a520->0xfffffe0045e838c7

last started kext at 1803256340213: com.apple.filesystems.smbfs	7.0 (addr 0xfffffe0044fa0480, size 124085)
Post-boot loaded kexts:
com.apple.filesystems.smbfs [loaded at 0x6ab7d161]
com.apple.driver.usb.AppleUSBHostiOSDevice [loaded at 0x6ab79123]
com.apple.filesystems.autofs [loaded at 0x6ab66bc1]
com.apple.driver.usb.cdc.ncm [loaded at 0x6ab79124]
com.apple.driver.driverkit.serial [loaded at 0x6ab66bc0]

** Stackshot Succeeded ** Bytes Traced 985353 (Uncompressed 2485744) **